A practical blueprint for planning, instrumenting, and communicating event performance, from registration through post-event ROI. This guide is for marketing, operations, and revenue teams that want trustworthy numbers for decision-making. When you want to see working dashboards and shareable reports in a live environment, explore analytics.

What counts as event analytics and reporting?
Event analytics covers the capture, processing, and presentation of data from your event platform and related systems so teams can assess performance and act. It spans registration and checkout, on-site engagement, mobile app usage, exhibitor lead capture, surveys, and post-event attribution. To evaluate any approach, keep these dimensions in view:
- Data sources and coverage, what data is collected across registration, on-site, mobile, virtual, exhibitors, and surveys.
- Metric definitions, naming conventions, formulas, and accepted ranges, for example conversion rate, no-show rate, dwell time, and pipeline influence.
- Attribution model, first touch, last touch, or multi-touch rules, and which systems participate, CRM, MAP, analytics, and ad platforms.
- Latency and freshness, what is real-time versus batched, and how soon stakeholders can trust numbers for decisions.
- Segmentation and slicing, filters for ticket type, channel, persona, account tier, session, or exhibitor.
- Shareability and governance, permissions, scheduled sends, audit trails, and versioned metric docs so numbers are consistent across teams.
How event analytics should flow, at a glance
Your event platform produces the core signals—registrations, orders, check-ins, session scans, app interactions, exhibitor leads, and survey results. Those flow into:
- Analytics and pixels, GA4, GTM, LinkedIn, and Meta to measure conversion and paid performance.
- CRM and MAP, for pipeline, campaign performance, and nurture outcomes.
- Dashboards, in-platform reporting, BI, or a warehouse where you model and join event data to revenue.
A simple principle: the closer the use case is to a customer-facing action, the more valuable near-real-time becomes. For example, GTM Preview during checkout and same-day attendance dashboards for on-site decisions. Heavy summaries, such as revenue rollups and attribution, often run on short batches.
Outcome-first playbooks
Each playbook explains why it matters, what good looks like, and how to verify it in a demo.
Playbook 1: Define your KPI framework and taxonomy
Why it matters
If definitions drift, teams argue over numbers. A shared framework accelerates decisions and prevents one-off spreadsheets.
What good looks like
- A short metric dictionary for registration, attendance, engagement, sponsor value, and revenue.
- Channel and campaign naming rules with examples and allowed values.
- A clear owner for metric changes and a visible change log.
Verify in a demo
Ask to see where metric definitions live, how reports reference them, and how changes propagate without breaking historical views. For baseline measures to include in your dictionary, see 9 Key Event Metrics to Track Success.
Playbook 2: Track registration, checkout, and conversion end-to-end
Why it matters
Registration is your revenue engine. Clean inputs and clear steps improve conversion rates and downstream reporting accuracy.
What good looks like
- Funnel visibility for views, starts, abandons, and purchases by channel and campaign.
- Parameters, UTMs, and referrers preserved through checkout.
- Group and multi-attendee orders represented correctly in revenue reports.
Verify in a demo
Run a sandbox purchase while GTM is in Preview. Watch GA4 receive add_to_cart and purchase with value and items, then confirm revenue lines up with in-platform reporting. For sync and attribution patterns that keep reports clean, read How to Capture and Use Event Data in HubSpot.
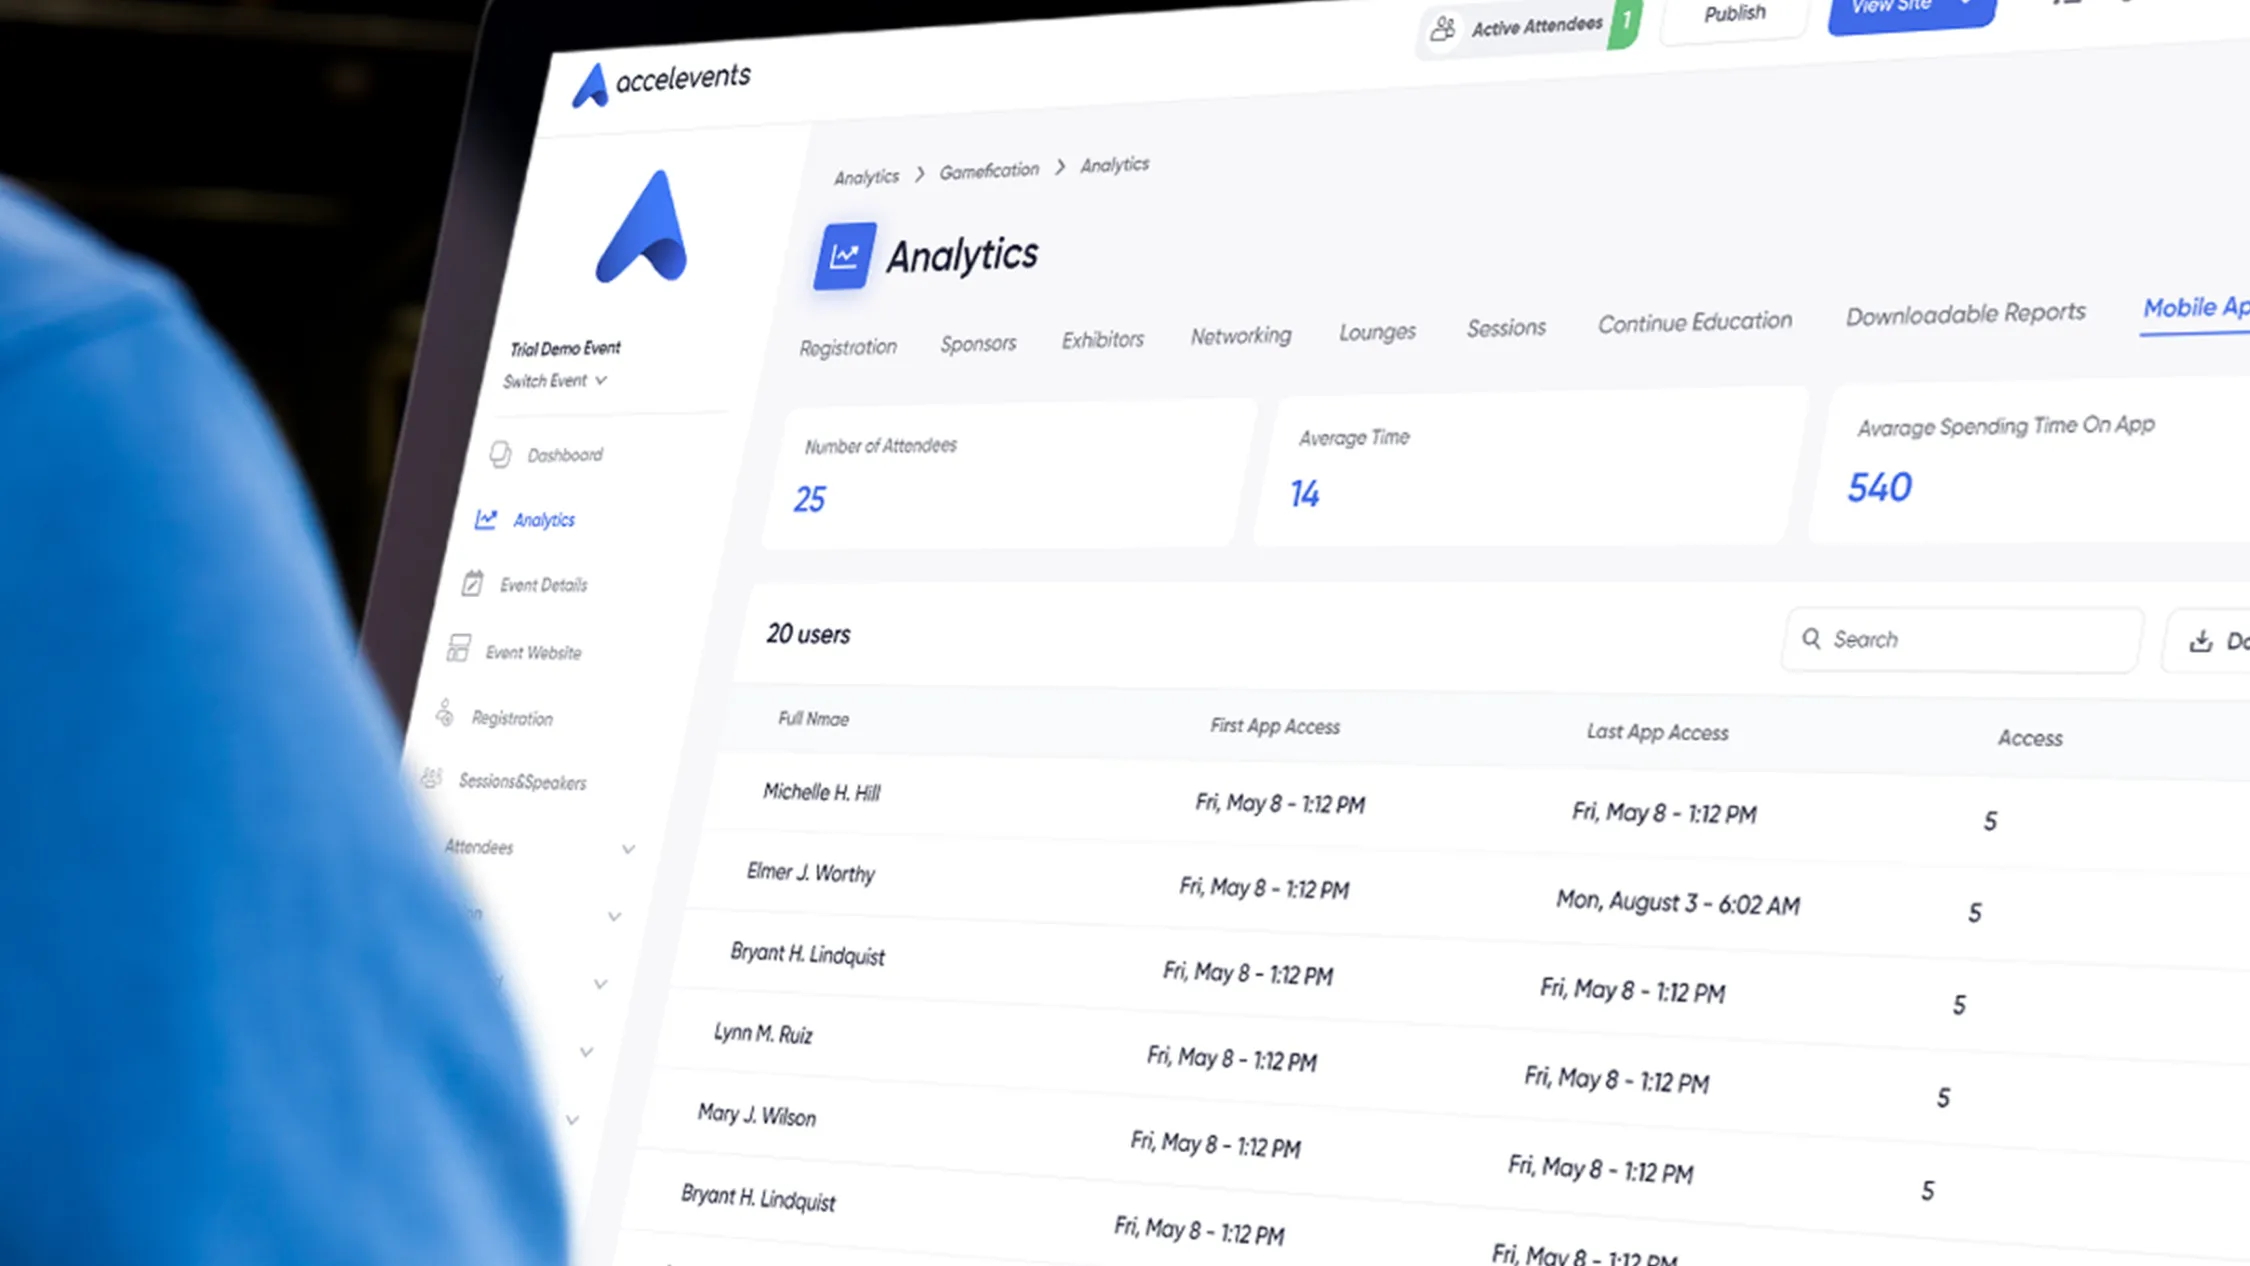
Playbook 3: Measure on-site and session engagement
Why it matters
Real attendance and dwell time inform staffing, content decisions, and CE credit issuance. Clean scans drive accurate session popularity and room utilization insights.
What good looks like
- Same-day check-in and session dashboards with filters for ticket type and role.
- Badge and scanner settings that minimize failed reads and duplicate scans.
- Session capacity alerts when rooms near thresholds.
Verify in a demo
Scan a badge into a test event, watch attendance rise on a live dashboard, then export a session report with timestamps and durations. For why these signals matter and how to act on them, review Why Event Analytics Are Important and Event Data Trends: Planners as Analysts.
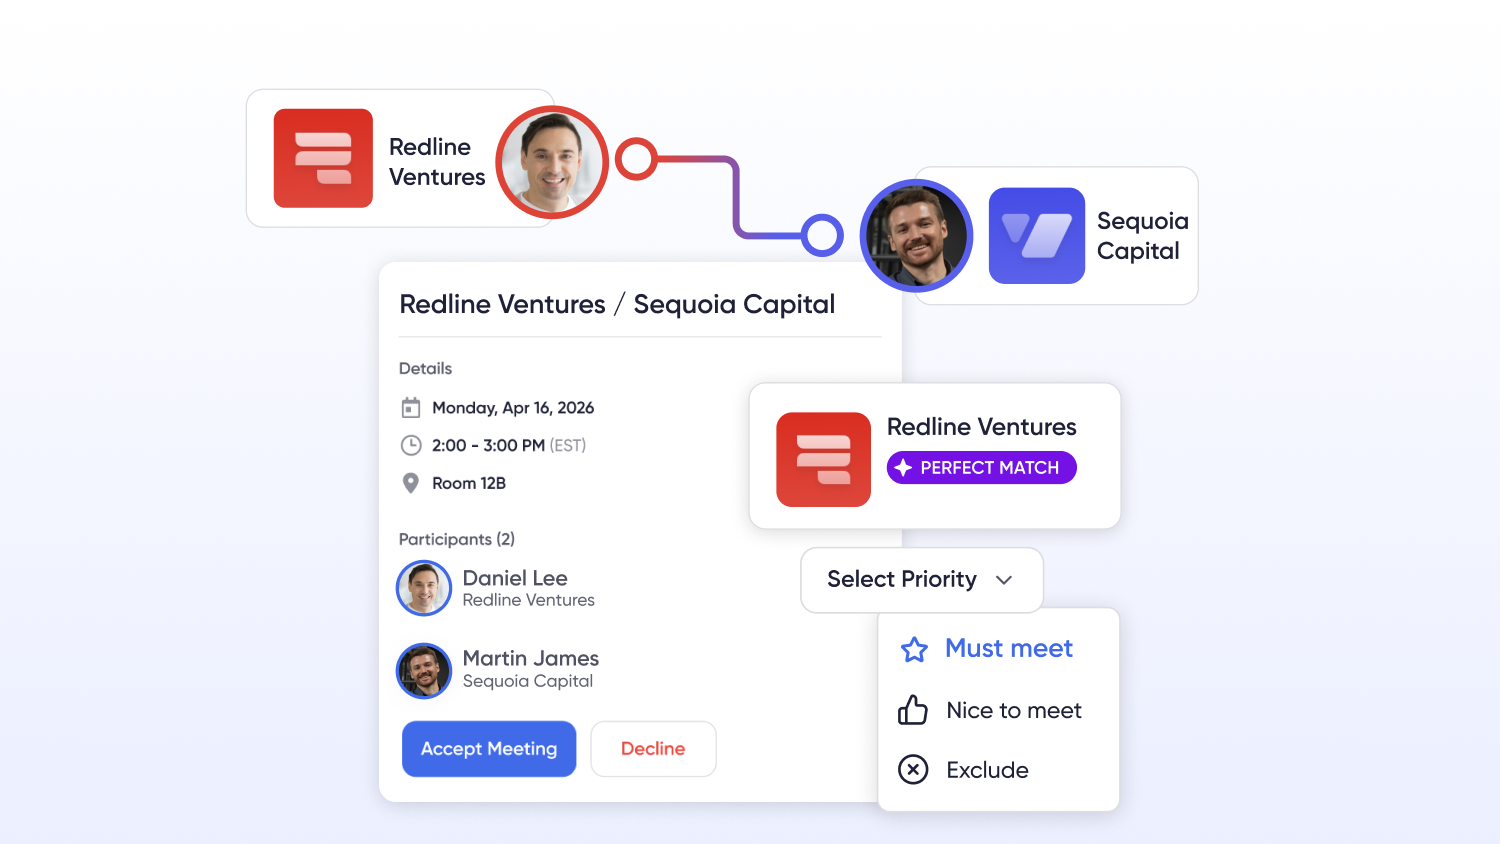
Playbook 4: Prove sponsor and exhibitor ROI
Why it matters
Sponsors renew when you can quantify reach, engagement, and high-quality leads quickly after the show.
What good looks like
- Lead capture with notes, scoring, and meetings, plus owner assignment back to CRM.
- Shareable, branded summaries that exhibitors can view without extra logins.
- UTM-aware reporting for sponsor promotions and session sponsorship impact.
Verify in a demo
Capture a test lead on mobile, add a note and score, see it appear in CRM, then open an exhibitor-facing report that updates in real time. For evidence stakeholders expect, read Which Event Tech Vendors Offer Detailed Sponsor Analytics.
Playbook 5: Connect post-event reporting to attribution and pipeline
Why it matters
Executives care about influenced revenue and velocity. Clear hand-offs to CRM and MAP make post-event action measurable.
What good looks like
- Campaigns and Campaign Member statuses aligned to events; Registered and Attended update reliably.
- Cohort and multi-touch views that show opportunity creation, stage progression, and renewal impact.
- Scheduled snapshots that deliver the same numbers to leaders every week.
Verify in a demo
Trace a registrant from form fill through attendance and into CRM as a Campaign Member, then open an attribution report that rolls up opportunity impact by event. For a KPI list to validate outcomes, reference Virtual Event KPIs: How to Measure Success.
Measure and share checklist
Use this whenever you plan an event or revise reporting.
- Define 8–12 KPIs across registration, attendance, engagement, sponsors, and revenue, then publish a one-page metric dictionary.
- Confirm UTM and campaign conventions and where they are stored.
- Set real-time versus batch expectations per metric, for example same-day attendance versus weekly attribution.
- Build one default dashboard with filters for role, channel, and ticket type.
- Configure scheduled sends for leadership and exhibitors.
- Establish a naming convention for events, sessions, and campaigns to keep reports sortable.
Data quality and governance checklist
Bake these steps into your analytics practice.
- Validate GA4 and pixels in a sandbox with GTM Preview before launch.
- Run a day-of-show QA, test scans, session counts, and app events on a timer.
- Reconcile revenue between checkout, analytics, and finance weekly.
- Version your metric dictionary and log changes.
- Review roles and access, remove stale viewers and rotate keys quarterly.
- Document where data lives long-term—in-platform, CRM, MAP, warehouse—and define retention policies.
Systems map, the picture in words
At the center, your event platform captures registrations, check-ins, sessions, mobile interactions, exhibitor leads, and surveys. Downstream, analytics and pixels measure conversion and paid performance, CRM and MAP own pipeline and nurture outcomes, and dashboards present unified reporting. A thin orchestration layer handles bursts at launch and during show hours, then batches heavier jobs. Monitoring and alerts sit above everything so anomalies are caught quickly and explained in post-mortems.
Mini comparisons to request in a demo
Ask vendors to show, not tell.
- Real-time dashboards for registration and attendance that filter by channel, ticket type, and role.
- GTM Preview and GA4 purchase events with value and items during a sandbox checkout.
- Exhibitor-facing reports that are shareable and update in real time.
- Scheduled snapshots and permission controls that prevent ad-hoc spreadsheet drift.
- Export or API options for BI and warehouses, including field dictionaries.
- Attribution views that connect events to opportunity creation and progression without manual stitching.
If you want to see these patterns operating together, take a look at analytics.
Governance and scale
Analytics becomes a durable practice when definitions, ownership, and access are explicit. Assign a steward for metric docs, centralize dashboards, and schedule routine audits of filters and formulas. As you add a CDP or warehouse, decide which metrics remain source-of-truth in the event platform versus being remodeled downstream, then document those decisions where report builders will see them. To validate how you treat mobile engagement signals, align your taxonomy with common patterns surfaced in 12 Best Event Apps for Conference Success in 2025, and note which app behaviors you will normalize in reporting.
FAQs
Which KPIs matter most for B2B events?
Start with registration conversion, attendance rate, session popularity, engagement actions such as app usage or meetings, lead quality, and influenced pipeline. Add sponsor-specific KPIs like leads captured and demo requests. For additional context, see 9 Key Event Metrics to Track Success.
How do you calculate event ROI?
Combine direct revenue from orders and tickets with influenced revenue from opportunities tied to the event campaign. Subtract fully loaded costs, then track ROI over time by cohort and channel.
What should be real-time versus batched?
Attendance, check-ins, and funnel conversion are most useful same-day. Revenue reconciliations and attribution are often batched daily or weekly. Make operational decisions on real-time metrics and executive decisions on scheduled summaries.
Do we need GA4 if we already have in-platform reports?
In-platform reports answer event-specific questions quickly. GA4 adds web and paid channel context, cross-domain journeys, and standard e-commerce events. Many teams use both, with GTM as the control plane for QA.
How should we share reports with stakeholders?
Stand up one canonical dashboard per audience—leadership, marketing, sales, and exhibitors—set scheduled sends, and restrict edit rights. Include a link to your metric dictionary in every report.
Ready to see these best practices in a live environment?
Request a demo and we will tailor dashboards and reports to your goals.